The Dashboard Does Not Doubt Itself
Numbers Arrive Pre-Decided
Dashboards, A/B testing tools, and automated analytics now drive decisions across commerce. They emit numbers that look final: "variant B lifts conversion 12%", "this cohort churns 3x faster", "the campaign returned 4.2x". The interface renders each one in confident type, with no wobble, no asterisk, no doubt.
The problem is that a large share of those numbers come from samples that swing wildly, from comparisons that were cherry-picked, or from tests that were quietly repeated until something crossed a line. The tool does not flag any of that. It reports the number and moves on.
Your edge as a decision maker is not running the statistics yourself. It is reading the sample, the interval, the comparisons, and the effect size well enough to know which confident numbers to trust, which to hold, and which to send back for more data.
This lesson covers five reflexes: (1) sample size and noise, (2) confidence intervals and uncertainty, (3) p-hacking and multiple comparisons, (4) effect size versus statistical significance, and (5) base rates and provenance. We close with a checklist you can run against any study or report in under two minutes.
The A/B Result That Reversed
A concrete scenario to open on:
Your growth team launches an A/B test on Monday. By Tuesday the tool shows variant B winning by 18% with a green "significant" badge, based on 240 visitors per arm. The team wants to ship B to everyone immediately. You ask them to let it run. By the following Monday, at 9,000 visitors per arm, variant B is actually 1% behind A, and the badge is gone.
Small Samples Swing Wildly
Statistical Power in Plain Terms
Every measurement from a sample is the true value plus noise. The smaller the sample, the larger the noise relative to the signal. This is not a flaw you can code around. It is the arithmetic of averaging fewer observations.
A useful rule of thumb: the noise in an estimate shrinks with the square root of the sample size, not the sample size itself. To halve your uncertainty you need four times the data. To cut it to a tenth you need one hundred times the data. This is why early results are so volatile and why the last stretch of a test feels slow.
Statistical power is the probability that a test detects a real effect of a given size, if that effect truly exists. An underpowered test is one with too few observations to reliably see the effect it is looking for. Underpowered tests fail in two directions: they miss real effects, and, when they do report a "significant" result, that result is more likely to be a noisy overestimate. This second failure, the exaggerated winner, is the one that burns decision makers.
The practical discipline: before running a test, decide the smallest effect worth acting on, then compute the sample size needed to detect it. Run to that size. Do not read the tea leaves on day one.
Diagnosing an Underpowered Report
An automated report lands on your desk. It compares churn across 14 customer segments this quarter. The headline says "Segment 7 churn jumped to 22%, far above the 9% average, investigate urgently." You look at the fine print. Segment 7 contains 46 customers this quarter. Segment 7 had 41 customers last quarter, when its churn was 7%.
A Point Estimate Without an Interval
The Bar Around the Dot
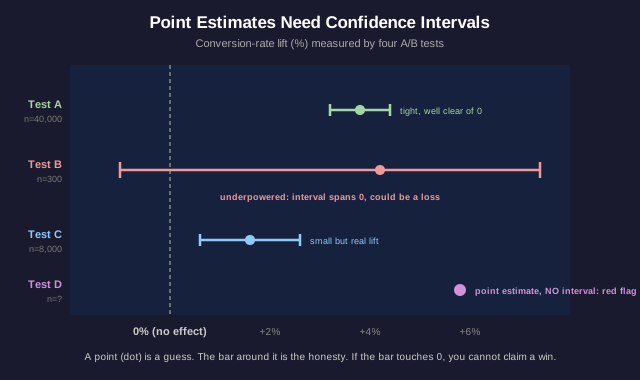
A point estimate is a single best-guess number: the lift is 12%, the mean is 4.2, churn is 9%. A confidence interval is the range the true value plausibly occupies given the noise in the data: the lift is 12%, plus or minus 9%, so plausibly anywhere from 3% to 21%.
The point estimate is the guess. The interval is the honesty. A report that shows a point estimate with no interval, no error bar, no range, is hiding the one number you most need. Treat a naked point estimate as a red flag, not as precision.
Overlapping intervals carry a specific lesson. If variant A's interval is 3% to 21% and variant B's interval is 1% to 19%, those ranges overlap heavily. You cannot claim A beats B, because the data is consistent with them being equal, or with B being ahead. Two point estimates can differ while their intervals say the difference is noise.
A subtler trap: a wide interval that still sits entirely above zero tells you the effect is real but its size is uncertain. A wide interval that straddles zero tells you that you do not even know the sign. Those demand different decisions. The width of the interval is information, not decoration.
Reading Two Overlapping Intervals
A vendor pitches you their recommendation engine. Their slide reads "Our engine lifted average order value to $58.40 (95% CI $54.10 to $62.70). The control averaged $55.90 (95% CI $51.30 to $60.50)." They conclude, in bold, "a clear $2.50 win per order, ship it."
Test Enough Things and Something Wins
The More You Look, the More You Find
A p-value of 0.05 means that if there were truly no effect, you would see a result this strong about 1 time in 20 by pure chance. That is a tolerable risk when you run one honest test. It becomes a near-certainty of a false positive when you run twenty.
Multiple comparisons: if a dashboard slices your users by 20 dimensions (device, region, hour, referrer, plan tier, and so on) and flags whichever slice looks "significant", you should expect about one false winner every run even when nothing real is happening. The tool is not lying about any single test. It is silently running many tests and reporting the luckiest one.
P-hacking is the family of moves that manufacture significance: trying many outcome metrics and reporting the one that crossed the line, adding and dropping controls until the p-value dips, stopping data collection the moment it looks significant, or splitting the data into subgroups until one subgroup "responds". None of these require dishonesty; motivated analysts p-hack without noticing.
The defenses are structural. Pre-registration: write down the one hypothesis and the one metric before seeing the data. A holdout: reserve a fresh slice of data and confirm the finding survives on data that had no chance to be cherry-picked. Correction: when you must run many tests, raise the bar (Bonferroni, false-discovery-rate control) so the threshold accounts for the number of looks. A finding that survives a holdout is worth far more than one that merely crossed 0.05 on the first pass.
The Analyst Who Found a Winner
An analyst reports "great news, we found that our email campaign significantly increased purchases (p = 0.03) among users who are on Android, in the 25-34 age band, who opened the email after 8pm." They are asking for budget to scale the campaign to everyone. You learn the analyst looked at purchase rates across device, age band, and time-of-day slices before landing on this combination.
Significant Can Still Mean Tiny
Two Different Questions
Statistical significance answers one question: is this effect distinguishable from zero? Effect size answers a different one: how big is the effect? A result can be resoundingly significant and utterly trivial at the same time.
The link is sample size. With a large enough sample, almost any difference becomes statistically significant, because the interval shrinks until even a microscopic effect no longer touches zero. A test on 5 million users can report that a new button color "significantly" lifts clicks by 0.02%, with p < 0.0001. The p-value is impeccable. The effect is worthless.
So significance without effect size is only half a sentence. The decision maker's questions are: how large is the effect, is it large enough to matter for this decision, and does its value exceed its cost? A 0.02% lift that requires a six-month engineering project fails on practical grounds no matter how significant it is.
Flip it around too. A large, promising effect size with a wide interval (from an underpowered test) can be a genuine opportunity worth a bigger, properly powered follow-up. Significance and effect size are two independent dials. Read both.
Significant but Worth Shipping?
Your platform team ran a rigorous, well-powered experiment on 4 million sessions. Result "the new checkout layout significantly increases completed purchases, p < 0.001. The lift is +0.05 percentage points (from 4.10% to 4.15% completion)." Shipping the layout requires a two-month rebuild and will complicate the codebase. The team argues "it is statistically significant, so we are obligated to ship it."
Who Collected This, and Does It Generalize?
The Numbers Came From Somewhere
Before any p-value or interval, ask where the data came from. Two questions do most of the work: what is the base rate, and does this sample generalize to the population you care about?
Base rates anchor every rate you read. A test that is "95% accurate" at detecting fraud sounds excellent until you note fraud occurs in 0.1% of transactions: at that base rate, the vast majority of flagged transactions are false alarms, because 5% of the huge honest majority dwarfs 95% of the tiny fraudulent minority. Ignoring the base rate is how a technically accurate model produces a uselessly noisy alert stream. Always ask what the underlying rate is before judging a rate-of-detection or rate-of-response number.
Provenance is the chain of custody of the number. Who collected it? How? On whom? A survey answered by your most engaged users does not describe your churned users. A conversion rate measured during a holiday promotion does not describe a normal Tuesday. A benchmark run by the vendor selling the product is not a neutral measurement. Sampling method, timing, instrument, and who benefits from the result all shape whether a number generalizes to your decision.
Generalization is the final gate. Data collected in one context (one country, one season, one customer tier, one device) may not transfer to another. The number can be perfectly measured and still be the wrong number for your question. "True here" and "true for my decision" are different claims.
The Case Study on the Vendor's Site
A software vendor's landing page claims "companies using our tool saw a 35% increase in productivity." The figure comes from a case study of 3 client companies that the vendor selected and wrote up, measured by those companies self-reporting hours saved, over the first month after a hands-on white-glove onboarding by the vendor's own team.
The Two-Minute Skeptic's Checklist
Run This Against Any Study, Dashboard, or Automated Report
You now have the five reflexes. Here they are as a checklist you can run in under two minutes against any confident number that lands on your desk.
1. Sample and power. How big is the sample behind this number? Is it large enough to detect an effect worth acting on, or small enough to swing on a handful of observations? A rate on a tiny group is mostly noise.
2. Interval, not point. Is there a confidence interval or error bar, or just a naked point estimate? A point with no interval is a red flag. If two things are compared, do their intervals overlap? Overlap means the difference is not established.
3. How many comparisons? Was this one pre-declared test, or the luckiest slice out of many? Ask how many metrics, segments, or variants were examined. A "significant" winner pulled from a search needs a fresh holdout or pre-registered confirmation before you believe it.
4. Effect size versus significance. Set the p-value aside for a moment: how big is the effect, and is it big enough to matter for this decision against its cost? "Significant" on a huge sample can still be trivially small.
5. Base rate and provenance. What is the underlying base rate this number sits against? Who collected the data, how, on whom, and who benefits from the result? Does the context it was measured in match the decision you are making?
One sentence to carry out the door: a number is a claim, not a fact, until you have seen its sample, its interval, its comparisons, and its origin. The tools will keep emitting confident figures. Your job is to read the four things they leave out.
Recommended reading to go deeper is Darrell Huff's "How to Lie with Statistics", Charles Wheelan's "Naked Statistics", Regina Nuzzo's writing on p-hacking, and the CONSORT guidance on reading a study's methods.