One Source Is Only a Line
Locating Truth Like a Surveyor
A surveyor who wants to fix the position of a distant fire cannot do it from a single lookout tower. One tower gives a bearing: a direction, a compass angle toward the smoke. A bearing is a line, not a point. The fire could sit anywhere along that line, near or far.
To pin down the fire you need a second, independent bearing from a different tower. Each bearing is a line; two lines that are not parallel cross at exactly one point. That intersection is the fix. This is triangulation, and it is the shape of all verification: one source points a direction, independent sources intersect on the truth.
The Coordinate Setup
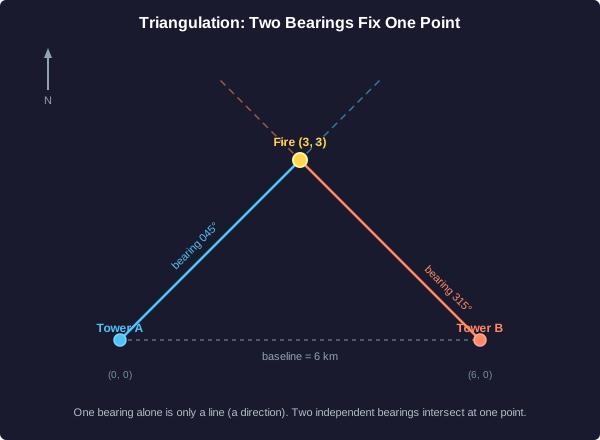
Put Tower A at the origin (0, 0) and Tower B at (6, 0), so the towers sit 6 km apart on an east-west baseline. Let east be the +x direction and north be the +y direction. Bearings run clockwise from north.
A bearing of 045 degrees points exactly northeast: east and north increase at the same rate. The line of sight from Tower A at bearing 045 is therefore y = x.
A bearing of 315 degrees points exactly northwest: north increases as east decreases at the same rate. The line of sight from Tower B (starting at x = 6) is therefore y = 6 - x.
Two lines, one unknown point. That is enough to solve.
Fix the Fire
Tower A reports the smoke at bearing 045 degrees. Tower B reports the same smoke at bearing 315 degrees.
The two lines of sight are y = x (from Tower A) and y = 6 - x (from Tower B), with distances in kilometers, east as +x, north as +y.
A Measurement Is a Region, Not a Point
Real Bearings Are Fuzzy
The clean intersection assumed each bearing was a perfect line. Real instruments are not perfect. A compass reading of 045 degrees really means "somewhere in a narrow wedge around 045." A measurement is not a point; it is a region: an interval, an error bar, a confidence area that says where the true value plausibly lives.
When two independent measurements each carry a region, the truth plausibly lies where the regions overlap: the intersection. The intersection of two fuzzy wedges is smaller than either wedge alone, so combining independent measurements shrinks the uncertainty. This is triangulation with thick lines: even blurry bearings, crossed, box the truth into a small area.
The Red Flag
A claim reported as a single confident number with no error region at all is a warning sign. Without a region you cannot tell a precise measurement from a wild guess: both look like a bare number. An honest estimate carries its uncertainty with it. A number with no error bar is hiding how much it does not know.
Independence matters. Two measurements that share the same flaw do not overlap into a smaller truth; they agree on the same error. The regions must come from genuinely separate methods.
Why Overlap Beats a Bare Number
Two independent labs estimate the same quantity. Lab 1 reports a value with an error region; Lab 2, using a completely different method, reports its own value with its own error region. The two regions partly overlap.
Trust the Cluster, Question the Outlier
Independent Estimates Cluster
Ask several independent sources for the same quantity and plot their answers on a line. When the estimates cluster tightly (small spread), you can trust the center of the cluster: many separate paths arrived at nearly the same place, and that is hard to fake by accident.
A single confident answer sitting far from everything else is a lonely outlier. It may be a breakthrough, but far more often it is an error, a different question answered, or a source that is simply wrong. The outlier earns scrutiny, not trust, precisely because it disagrees with the convergence.
Averaging Shrinks the Spread
Why does a cluster of independent estimates beat any one of them? Because averaging cancels independent noise. If a single reading has standard deviation (spread) of sigma, the average of n independent readings has standard deviation:
sigma / sqrt(n)
The variance falls like 1/n and the standard deviation like 1/sqrt(n). Four independent readings halve the spread (sqrt(4) = 2). One hundred readings cut it to a tenth (sqrt(100) = 10). More independent looks, less noise, a tighter cluster around the truth.
How Much Does Averaging Help?
An instrument measures a fixed quantity with random, independent noise. A single reading has a standard deviation of 10 units. There is no bias: the readings scatter symmetrically around the true value.
Projecting Onto the True Direction
Signal Is a Direction; Noise Points Everywhere
Picture each measurement as an arrow. Every arrow is the signal (the true value, pointing in one fixed direction) plus a noise arrow that points in a random direction, different every time. A single measurement is signal plus one random kick: you cannot see which part is which.
Average many independent measurements and the signal arrows, all pointing the same way, add up. The noise arrows, pointing every which way, largely cancel. What survives is the projection onto the true direction: the signal grows with n while the noise grows only with sqrt(n), so the ratio of signal to noise improves like sqrt(n). This is the same 1/sqrt(n) law from the other side.
This is why independence is everything. If the noise arrows all point the same way (sources copying one another, a shared bias), they do not cancel; they add, just like the signal. Ten copies of one source are still a single bearing. Only genuinely independent looks let the noise average away.
So the whole toolkit is one geometric picture: independent bearings intersect on the truth, independent error regions overlap into a smaller region, and independent measurements average the noise toward zero. Verification is the art of getting more than one honest direction on the same point.
One Confident Answer Is One Bearing
The Modern Verification Problem
Automated systems now produce most first-draft answers in commerce and knowledge work: a price, a summary, a diagnosis, a citation, a number in a report. Each answer arrives fluent and confident. But fluency is not accuracy, and confidence is not a second source. Each automated answer is exactly one bearing: a single line, a direction, not a fix.
A careful professional does not mistake one confident line for a located point. They triangulate: they get a second, independent bearing, then a third. They look at the spread of the independent answers. They trust a tight cluster and they treat a lonely confident answer, far from everything else, as an outlier to check, not a truth to ship.
And they guard independence. A second source that merely echoes the first (same data, same method, same automated origin) is not a second bearing at all. It is the same line drawn twice.
What the Professional Does Next
You ask an automated system a factual question. It returns a confident, fluent, specific answer, with no error region and no sources.
Verification Is Geometry — Summary
What You Have Learned
Knowing what is true has the shape of locating a point:
- Triangulation: one source gives a bearing, a line, not a point. Independent bearings intersect on the truth. Two towers fixed the fire at (3, 3); one tower never could.
- Error regions: a real measurement is a region, not a point. Independent regions overlap into a smaller intersection, tightening the truth. A claim with no error region is a red flag.
- Convergence versus the lonely outlier: independent estimates that cluster tightly earn trust; a lonely confident value earns scrutiny. Averaging shrinks the spread like 1/sqrt(n).
- Signal versus noise: signal arrows add, independent noise arrows cancel, so the signal-to-noise ratio improves like sqrt(n). Only genuinely independent looks let the noise average away.
Automated systems hand you fluent, confident first drafts all day long. Each is one bearing. The professional does not mistake a single line for a fix: they triangulate, read the spread, trust the cluster, distrust the lonely outlier, and guard the independence of every source.