A Decision Is a Shape
Choices Have Geometry
Every decision under uncertainty spreads possible payoffs across a number line. Some outcomes reward you, some cost you, and each carries a probability. That cloud of weighted payoffs has a shape: & the shape is what you actually decide about.
The first landmark of that shape is its expected value (EV): the probability-weighted average of the payoffs.
EV = sum of p_i x_i
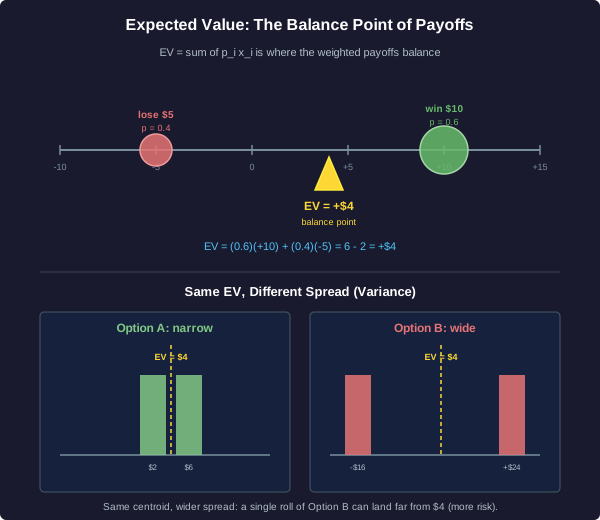
where each x_i is a payoff and each p_i is its probability. Think of it as physics: place a mass p_i at position x_i on a number line. The expected value is the centroid, the single balance point where the weighted payoffs teeter without tipping.
A heavier probability pulls the balance point toward its payoff. A rare outcome, however extreme, barely moves it. EV is not the outcome you will get on any single try: it is the center of mass of every outcome you could get.
Find the Balance Point
A street vendor offers a game that costs nothing to enter.
- 60% of the time you win $10.
- 40% of the time you lose $5.
Treat a win as +10 and a loss as -5.
The Balance Point Is Not the Whole Story
Same Center, Different Shape
The centroid tells you where a payoff cloud balances. It says nothing about how far the outcomes scatter from that balance point. That scatter is spread, measured by variance: the average squared distance of the payoffs from the centroid.
Two options can share an identical expected value yet have completely different shapes:
- Option A: 50% chance of $2, 50% chance of $6. EV = 0.5(2) + 0.5(6) = $4.
- Option B: 50% chance of -$16, 50% chance of $24. EV = 0.5(-16) + 0.5(24) = $4.
Both balance at $4. But Option A's outcomes huddle close to the center, while Option B's fling far to either side. Geometrically, A is a narrow shape & B is a wide one.
For a decision you repeat thousands of times, spread often washes out & the centroid rules. For a one-shot decision, spread is everything: you get a single draw, & a single draw from B can land on -$16. The expected value never promises the average will show up on any one try.
One Roll Only
You must choose Option A or Option B, and you may play only once. There is no second try.
- Option A: 50% $2, 50% $6.
- Option B: 50% -$16, 50% $24.
Both have EV = $4.
The Line Where the Choice Flips
Where Better Becomes Worse
Lay your options out over the things you do not control: a probability, a price, a demand level. That space of unknowns is a feature space. Inside it, one option is better in some regions & the other option is better elsewhere. The surface separating those regions is the decision boundary: the set of points where the two options have exactly equal expected value.
On one side of the boundary, choose option one. Cross the boundary, & option two wins. The boundary itself is the knife-edge of indifference.
Here is a one-dimensional example. Your $1,000 bike might be stolen. An insurer offers full coverage for a $100 premium.
- Do not insure: expected cost = p x 1000, where p is the probability of theft.
- Insure: cost = 100, no matter what.
The boundary is the theft probability p where the two expected costs meet: p x 1000 = 100. Below p, self-insuring is cheaper on average. Above p, buying coverage wins. The single number p splits the whole probability line into a do-not-insure region and an insure region.
Solve for the Boundary
Same setup: theft loss $1,000, insurance premium $100 for full coverage.
Not insuring costs, on average, p x 1000. Insuring costs a flat 100.
When One Option Wins Everywhere
Better on Every Axis
Sometimes you do not need probabilities at all. Put each option in a space where every axis is a thing you care about: price, battery life, storage. If one option beats another on every axis at once, it dominates it. This is Pareto dominance.
A dominated option can never win, under any weighting of the axes & under any probabilities, because whatever the future holds, the dominating option was already better on that dimension too. You can discard the dominated option without a single calculation.
Compare two phones:
- Phone A: $200, 12-hour battery, 128 GB.
- Phone B: $250, 10-hour battery, 64 GB.
Phone A is cheaper, lasts longer, & holds more. It wins on all three axes, so A dominates B. No probabilities, no expected value, no trade-off weights: A is simply better.
Dominance is rare & precious. Most real choices are trade-offs: cheaper but slower, safer but smaller. The moment an option wins on one axis while losing on another, dominance evaporates & you are back to weighing axes, assigning probabilities, & comparing expected values.
Spot the Dominance
Consider two laptops:
- Laptop A: $900, 8-hour battery, 1.4 kg.
- Laptop B: $1,100, 6-hour battery, 1.8 kg.
Assume lighter is better and longer battery is better.
A Point Recommendation Hides the Shape
One Number Is Not the Decision
Automated recommenders are built to answer with a point: buy this, route here, approve that. A single pick is easy to display & easy to act on. But a point is a shadow of the shape it came from. It hides everything you learned to see.
The professional does not stop at the point. Before trusting a recommendation, they reconstruct the geometry behind it:
- Centroid (EV): is the pick chasing the highest expected value? Remember the centroid is a long-run average, not the outcome of any one try.
- Spread (variance): two options can share an EV yet differ wildly in risk. A point recommendation says nothing about how far a single outcome can stray, which is decisive for a one-shot call.
- Boundary: how close is this decision to flipping? If the inputs sit near a decision boundary, a small error in an estimate could reverse the right choice, & the confident-looking pick is actually fragile.
Seeing the centroid, the spread, & the boundary together is seeing the whole payoff geometry. The recommendation is a coordinate; the professional wants the map.
Read Behind the Recommendation
An automated tool studies your options and prints a single line: "Recommended choice: Option 3."
It shows no distribution, no risk band, and no sensitivity.
Geometry of Decisions: Summary
What You Have Learned
A decision under uncertainty is a shape, and four landmarks describe it:
- Expected value is a centroid: EV = sum of p_i x_i, the balance point of payoffs weighted by probability. Heavier probabilities pull the balance toward their payoff.
- Risk is spread: variance measures how far outcomes scatter from the centroid. Two options can share an EV yet differ in risk, and for a one-shot decision a wider spread can be far worse.
- The decision boundary is the flip line: the set of points where two options have equal expected value. Crossing it reverses the better choice, and decisions near a boundary are fragile.
- Dominance needs no probabilities: if one option wins on every axis, it dominates, and you can choose it with no weights or expected values at all.
Automated systems hand you a point. The professional sees the whole geometry: centroid, spread, & boundary, together. The recommendation is a coordinate; wisdom is reading the map it came from.