What SRE Solves
Welcome to Site Reliability Engineering
Site Reliability Engineering (SRE) started at Google in 2003. Ben Treynor Sloss took over a small ops team and rebuilt it as if engineers, not human pagers, ran production. The result became the standard model for running large internet services.
Traditional operations teams kept services running through manual work: restart this server, page that engineer, write a runbook, hope it holds. That model breaks at scale. A team of fifty operators cannot manually restart five thousand servers. Beyond a certain size, manual operations become a tax that consumes every productive hour.
SRE flips the model. Instead of hiring more operators when systems grow, SRE hires software engineers and tells them: write code that does the operational work for you. Your job qualifies as software engineering applied to operations problems. Your output: automation, monitoring, and engineered reliability, not manual interventions.
Three foundational ideas drive SRE practice:
- Service Level Objectives (SLOs): numerical reliability targets, agreed in advance
- Error budgets: the inverse of an SLO, spent on risk-taking
- Toil elimination: any operational work that scales linearly with system size must die
These three ideas cascade into every SRE practice: postmortems, on-call rotations, capacity planning, monitoring, and release engineering.
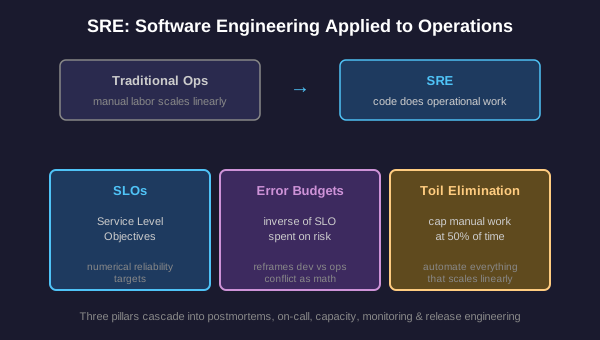
Traditional Ops versus SRE
Why Traditional Ops Breaks at Scale
A typical ops team grows linearly with the systems it manages. Double the servers, double the operators. This makes financial sense for small deployments and disastrous sense at scale: you cannot hire your way out of a quadratic problem.
SRE caps operations work at fifty percent of an engineer's time. The other half must go to engineering: building tools, automating processes, eliminating the toil that brought them to fifty percent in the first place. If toil exceeds fifty percent for too long, the team must shed work back to a development team or hire more SREs. The fifty percent rule prevents an SRE team from collapsing into a traditional ops team under sustained pressure.
Compare the failure modes:
- Traditional ops: more incidents lead to more manual responses, which leave less time for prevention, which creates more incidents. A doom loop.
- SRE: more incidents trigger postmortems, which surface automation opportunities, which reduce the next incident's response time. A virtuous loop, when it works.
SLI, SLO, SLA
Three Letters That Run Production
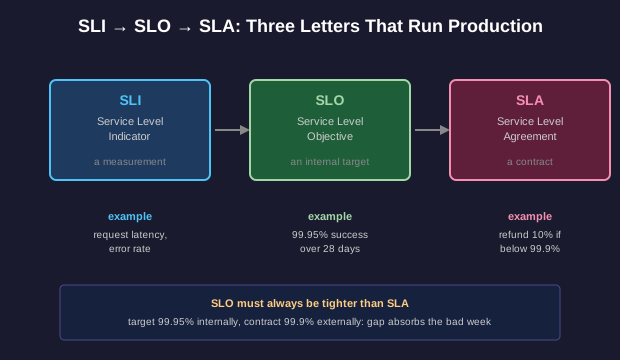
Reliability without measurement is theater. SRE makes reliability a number, agreed in advance, that everyone can verify.
Service Level Indicator (SLI): a measurement of service behavior. Examples: request latency, error rate, throughput, queue depth. An SLI is a thing you can graph.
Service Level Objective (SLO): a target value or range for an SLI. Example: '99.9% of HTTP requests succeed over a rolling 28-day window.' An SLO is a promise you make to yourself and your users about acceptable service quality.
Service Level Agreement (SLA): a contractual commitment, usually with financial penalties for violation. Example: 'We refund 10% if monthly availability falls below 99.9%.' An SLA is a promise enforced by lawyers.
Critical distinction: your SLA must always be looser than your SLO. If you target 99.9% internally and contract 99.9% externally, you have zero margin. SREs typically run SLOs at one nine tighter than the SLA: 99.95% target, 99.9% contract. The gap absorbs the inevitable bad week.
Error Budgets: The Inverse SLO
From Reliability Targets to Engineering Decisions
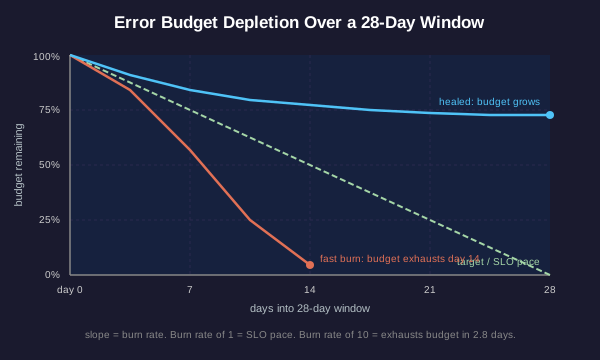
An SLO sets a reliability target. The error budget is what is left over: the amount of failure you can spend before missing the target.
If your SLO promises 99.9% success over 28 days, your error budget is 0.1% of requests, or about 40 minutes of complete downtime per month. That budget is yours to spend however you want: on planned releases, on experimental features, on chaos engineering, on tolerating a misbehaving dependency.
Error budgets reframe the dev versus ops conflict. Without a budget, every outage starts an argument about who shipped the bad change and how to prevent the next one. With a budget:
- Budget remains: ship faster, take more risks, run experiments. The budget pays for it.
- Budget exhausted: stop launching new features, freeze risky changes, focus on reliability work until the budget rebuilds.
This converts reliability from an emotional argument into a measurable resource. Engineers can spend the budget deliberately, like any other production input.
Defining Toil
What Counts as Toil
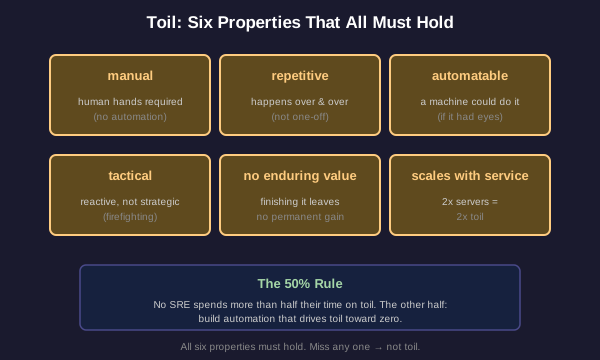
Not every operations task qualifies as toil. SRE defines toil precisely: work that is manual, repetitive, automatable, tactical, devoid of enduring value, & scales linearly as the service grows.
All six properties must hold. A one-time data migration is manual but not repetitive: that does not qualify as toil. A senior engineer designing a new service architecture handles a tactical decision but adds enduring value: that does not qualify as toil.
Examples that do qualify as toil:
- Manually restarting a service after a memory leak crash
- Pasting log fragments into a chat channel during incident triage
- Filling out a ticket form to provision a new database
- Running a quarterly capacity report by hand
- Approving routine deployment requests one by one
The fifty percent rule caps toil at half an SRE's time. Above 50%, the team must shed responsibility back to a product team or hire more engineers, but the goal stays clear: drive toil toward zero by replacing it with engineered systems that do the same work without human intervention.
Automation does not just save time. It removes a class of human errors entirely. A script that provisions a database does not forget steps after a long shift.
Toil Audit Reasoning
Your team tracks how its time gets spent. Last quarter the breakdown was: 30% deploys, 25% incident response, 20% capacity work, 15% feature engineering, 10% one-off requests from product teams.
On-Call Hygiene
Engineers, Not Pagers
On-call carries a real cost. Sleep gets disrupted, weekends get interrupted, and the stress of unknown problems compounds. SRE treats on-call as a finite resource that must remain sustainable, not a heroic burden borne by whoever cares most.
Healthy on-call rotations follow several principles:
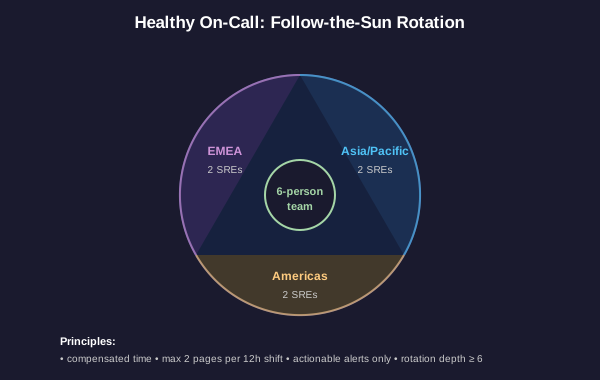
- Compensated time: on-call hours map to time in lieu, additional pay, or a comparable benefit. Free on-call burns out the team.
- Reasonable rotation depth: a six-person team running primary plus secondary means each engineer takes one shift every three weeks. Two-person rotations destroy careers.
- Page volume budget: Google's SRE book suggests a maximum of two paging events per twelve-hour shift. Above that, the team must invest engineering time in reducing alert volume, not just enduring it.
- Actionable alerts only: every page must require human action. If a page would be ignored, automated, or fires repeatedly during normal operation, it should not exist. Alert fatigue is a reliability defect.
- Follow-the-sun handoffs: globally distributed teams hand off shifts at timezone boundaries so nobody pages at 3 AM unless the system genuinely cannot wait until morning.
Blameless Postmortems
How Outages Become Improvements
Every significant incident gets a postmortem: a written analysis of what happened, why, what fixed it, and what changes prevent recurrence. The postmortem is the SRE equivalent of compound interest: each one adds permanent reliability to the system.
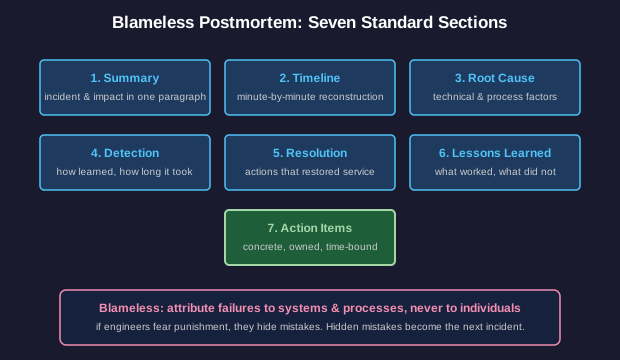
Blameless means the document attributes failures to systems and processes, never to individuals. If an engineer ran the wrong command, the postmortem asks: why did the system permit that command? Why did no safeguard catch it? What change to the system, the documentation, or the tooling would prevent the next engineer from making the same mistake?
Blamelessness exists for a single reason: people hide mistakes when they fear punishment. Hidden mistakes become the next incident. The cost of a blameless culture qualifies as cheap relative to the cost of accumulating undisclosed defects.
Postmortems typically cover:
- Summary: one-paragraph description of the incident & impact
- Timeline: minute-by-minute reconstruction with timestamps
- Root cause analysis: technical and process factors that allowed the failure
- Detection: how the team learned of the incident, and how long it took
- Resolution: the actions taken to restore service
- Lessons learned: what worked, what did not
- Action items: concrete, owned, time-bound engineering tasks
Action items live in a tracker. They get prioritized like any other engineering work. Postmortems without action items reduce to story time. The work changes nothing.
The Four Golden Signals
What Every Service Must Measure
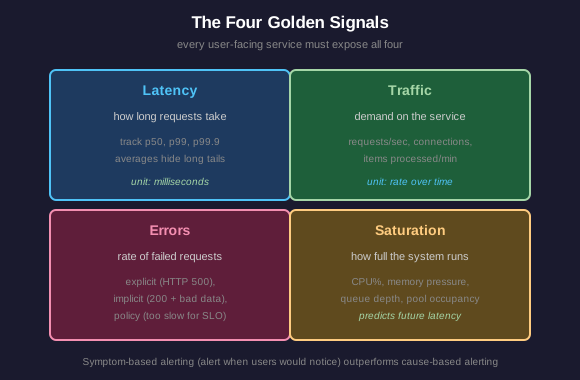
Google's SRE book proposes four signals every user-facing service must expose: latency, traffic, errors, and saturation. Together they describe service health from the user's perspective. Monitoring with fewer signals leaves blind spots; monitoring with hundreds of metrics buries the team in alert fatigue.
Latency: how long requests take. Track distributions, not averages. p50 (median) describes typical experience. p99 describes the worst 1% of users. Average alone hides long tails: a service with median 50 ms and p99 5,000 ms looks fine on the average but ruins one user in a hundred.
Traffic: the demand on the service. For a web service, this means requests per second. For a streaming service, simultaneous connections. For a batch job, items processed per minute. Traffic correlates with capacity decisions and reveals workload anomalies.
Errors: the rate of failed requests. Explicit failures (HTTP 500), implicit failures (HTTP 200 with corrupted data), and policy failures (response too slow to meet SLO) all count. Distinguishing between these matters: a 200 with bad payload often hurts users more than an honest 500.
Saturation: how full the system runs. CPU utilization, queue depth, memory pressure, connection pool occupancy. Saturation predicts future latency: a system at 95% CPU has very little headroom before user-facing latency spikes.
Most SRE alerts derive from these four signals. Symptom-based alerting (alert when users would notice) outperforms cause-based alerting (alert when CPU exceeds 80%). The four golden signals describe symptoms.
SRE Career Paths
Where SRE Skills Pay
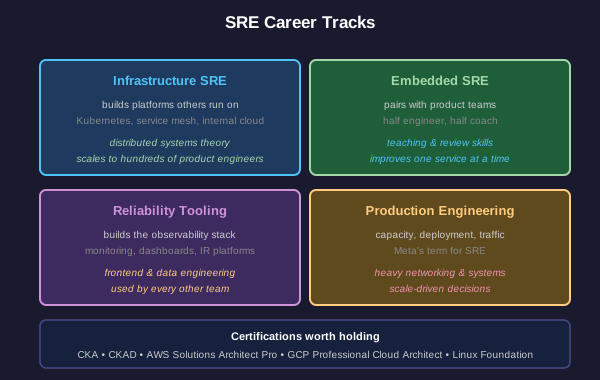
SRE careers diverge based on what part of the discipline an engineer enjoys most:
Infrastructure SRE: builds the platforms other teams run on. Kubernetes, service meshes, internal cloud. Heavy systems engineering, distributed systems theory, and platform design. Pays extremely well at large companies because the work scales: one infrastructure SRE supports hundreds of product engineers.
Embedded SRE: pairs with a product engineering team to improve a specific service's reliability. Half-engineer, half-coach. Strong communication and code review skills matter as much as technical depth. Often the best path for engineers who like teaching.
Reliability tooling: builds the observability stack: monitoring, alerting, dashboards, postmortem tools, incident management platforms. Heavy frontend and data engineering work. Output gets used by every other team.
Production engineering: the Facebook/Meta term for SRE focused on capacity, deployment, and traffic management. Heavy networking and systems work.
Technical certifications worth holding: the Google Cloud Professional Cloud Architect, AWS Solutions Architect Professional, and CNCF certifications (Kubernetes Administrator, Kubernetes Application Developer) signal cloud-native fluency. Linux Foundation certifications signal systems depth. None of these substitute for portfolio work, but they help filter recruiter screens.
Wrapping Up
What You Now Know
Site reliability engineering started as Google's answer to a scaling problem and grew into a discipline now practiced across the industry. You have covered:
- The shift from manual operations to engineered reliability
- SLIs, SLOs, SLAs, and the inverse-SLO concept of error budgets
- Toil definition, the 50% rule, and engineering-driven reduction
- Sustainable on-call rotations and blameless postmortem practice
- The four golden signals as a starting point for service monitoring
- SRE career tracks and the certifications that open doors
Two ideas matter most. Reliability is a number, agreed in advance. And toil is a defect, not a job description. Carry those two forward and the rest of SRE follows naturally.
Recommended reading: Google's SRE Book (free online: sre.google/books/), the SRE Workbook for hands-on exercises, and Charity Majors' writing on observability. The geometry-of companion lesson goes deeper on the visual structure underneath SRE practice: latency distributions, error budget cones, dependency graphs, and dashboard layouts.