Where Reliability Ends
Automation Has a Shape
Every automated system has a region where it works & a region where it breaks. Draw those two regions on a plane & you get a competence frontier: the curve that separates reliable behavior from failure.
Put two axes under it. The horizontal axis measures task complexity & novelty: how far a task sits from the ordinary cases the system was built for. The vertical axis measures stakes: how much a wrong output costs.
Near the origin, tasks are routine & low-stakes. The system handles them easily. This is the reliable region: work inside it freely.
Far from the origin, tasks are novel & high-stakes. The system guesses, & its guesses are expensive. This is the failure region: do this work yourself.
Between them runs a band along the frontier itself. Here the system is often right but not dependably right. This is the verify band: let the machine draft, but check every output before you trust it.
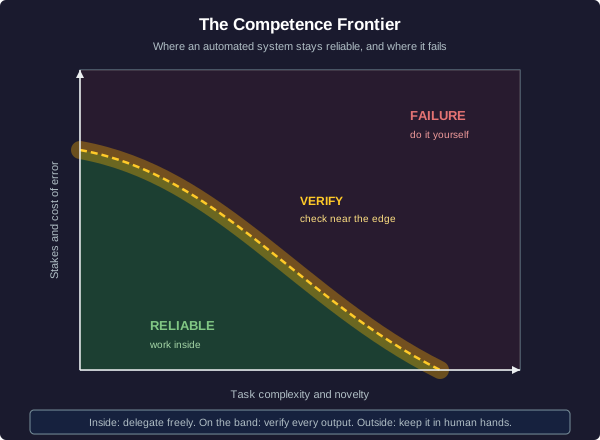
The whole discipline of working with automation reduces to one geometric habit: know which region your task sits in, & act accordingly.
Reading the Three Regions
A colleague drops a new tool into your workflow & says "just let it run on everything."
Two Curves and a Crossing Point
What to Delegate Is a Crossing Point
Knowing a task sits inside the frontier tells you the machine can do it. It does not tell you the machine should do it. For that, plot two curves.
Line up your tasks along the horizontal axis, ordered from the ones the machine handles worst on the left to the ones it handles best on the right. On the vertical axis, plot skill per task.
Draw the human skill curve & the machine skill curve across those tasks. Somewhere they cross. That crossover point is the geometric answer to "what should I delegate?"
To the right of the crossover, the machine curve sits above the human curve: hand those tasks off. To the left, the human curve sits on top: keep those.
The subtle part is comparative advantage, not absolute. You might be faster than the machine at almost everything. It still pays to delegate the tasks where the machine is relatively strong, because that frees your hours for the tasks where your advantage is largest. The crossover is about relative slopes, not who is better in isolation.
This is the same geometry economists use for trade between two producers: total output rises when each specializes where its relative advantage lives, even if one producer is better at everything.
Finding the Line
You run a small studio. You are personally better than your automated tools at every task you do. Your week is full, so hours spent one place cannot be spent another.
Errors Scale With Output
Leverage Multiplies Both Ways
Automation is a lever. Pull it once & you get many outputs for one unit of effort. Output grows linearly with the number of items you push through: ship N items, get N results.
The catch is that mistakes ride the same lever. If the system produces a wrong result with probability p on each item, then across N items the expected number of errors is:
expected errors = p x N
This is just the mean of a sum of N independent trials, each wrong with probability p. Double your volume & you double your expected defects. The error count is not a fixed cost you pay once; it grows with your leverage.
That single line reshapes how you verify. At N = 10, a 2% error rate means about one expected mistake: easy to catch by eye. At N = 100,000, the same 2% means 2,000 expected mistakes shipping into the world. Same system, same reliability per item, wildly different exposure.
So the rule: verification must scale with leverage. The more the lever multiplies your output, the more it multiplies the mistakes you must catch, & your checking budget has to grow with N, not stay fixed.
Counting the Defects
An automated pipeline formats product listings. On each listing it introduces an error with probability p = 0.02 (a 2% error rate). You run it over N = 4,000 listings in one batch.
Verify Where the Product Is Large
Two Dimensions, One Product
Expected error count tells you how many mistakes to expect. It does not tell you how much each one hurts. A misformatted internal note & a wrong figure on a tax filing are not the same defect.
So add a second dimension. On one axis put the probability of error. On the other put the cost of a single error. Every task is a point on that plane, & the quantity that should drive your verifying effort is the product:
verification effort should scale with (probability of error) x (cost of error)
Read as a surface, the product rises toward the corner where both are high & sinks toward the corner where both are low. Your verifying attention should follow the height of that surface.
The corners are easy. Frequent & catastrophic: verify hard. Rare & trivial: barely check. The instructive cases are the off-diagonal corners. A rare but catastrophic error still demands heavy verification, because the large cost carries the product even when probability is small. A frequent but trivial error may deserve almost none, because the tiny cost keeps the product low no matter how often it happens.
This is why "how reliable is it?" is the wrong lone question. Reliability is one axis. Cost is the other. You verify along the product of the two.
Which One Gets the Scrutiny
Two automated jobs run in your shop.
Job A drafts routine internal reminders. It errs fairly often, but a wrong reminder costs almost nothing: someone smiles & fixes it.
Job B files regulatory paperwork. It rarely errs, but a single wrong filing is catastrophic: fines, legal exposure, lost trust.
The Professional's Geometry
Where This Lands
Automated systems now sit between people & a growing share of commerce & knowledge work. They draft, sort, price, route, & summarize. The professional who works well alongside them is not the one who trusts them most or least. It is the one who reads the geometry.
Three shapes carry that judgment:
- The frontier: know where reliability ends. Delegate inside it, verify along it, keep the outside in human hands.
- The crossover: know what to hand off. Delegate the machine-advantaged side of the crossing, & remember finite time makes relative advantage the deciding factor.
- Leverage & the error surface: expected errors = p x N grow with scale, so verification must scale with leverage, weighted by probability x cost so your attention lands where mistakes are both likely & expensive.
None of this is about the machine's internals. It is about geometry: regions, boundaries, crossing points, & products. Get the geometry right & the tool amplifies you. Get it wrong & it amplifies your mistakes at the same rate.
Geometry of Automation: Summary
What You Have Learned
Deciding what to automate is applied geometry:
- The competence frontier: the curve between the reliable region & the failure region. Delegate inside, verify along the band, keep the outside in human hands.
- The comparative-advantage crossover: order your tasks, plot human skill against machine skill, & hand off the machine-advantaged side of the crossing. Finite time makes relative advantage decide, even when you are absolutely better.
- Leverage & scaling: output grows linearly with volume, & so do errors. Expected errors = p x N. A 2% rate over 4,000 items is 80 expected defects, so verification must scale with leverage.
- The cost-of-error surface: verify in proportion to (probability of error) x (cost of error). A rare but catastrophic error can outrank a frequent but trivial one.
The machine multiplies whatever you point it at. Read the geometry right & it multiplies your reach. Read it wrong & it multiplies your mistakes just as fast.